The 4-Stage Analytics Framework Using HMRC Job Satisfaction Data that guarantees employee experience.
Data Enthusiast. Passionate about Problem Solving, Analytical and Critical Thinking.
Most organizations measure job satisfaction. Fewer can explain why satisfaction drops. And almost none can predict which employees are most at risk of disengagement let alone prescribe targeted actions to fix it.
That is the gap I set out to close with my recent project, where I used the HMRC employee job satisfaction dataset, Plotly Studio for analysis, and a custom Dash app for predictive modelling. Before I proceed, you can access the short video of the whole interactive dashboard at the end of the article.
Let me take you through the 4-Stage Analytics Framework I applied and the results it delivered.
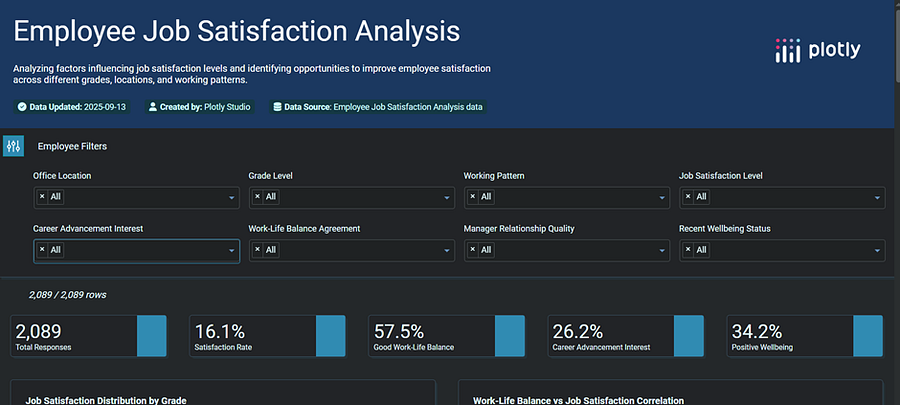
Employee Job Satisfaction Dashboard by Author -1
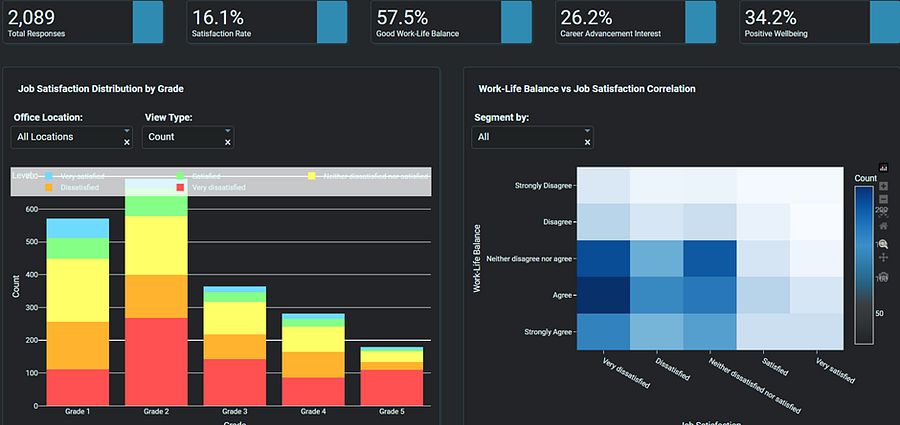
Employee Job Satisfaction Dashboard by Author — 2
- Descriptive Analytics: What Happened?
I started by asking the simplest question: What’s the current state of employee satisfaction?
The numbers were striking: 56% of employees reported dissatisfaction. On its own, this fact is useful but incomplete. It’s like a thermometer telling you the temperature without explaining why it’s hot or cold.
Wouldn’t you agree that knowing the “what” is only the beginning?
2. Diagnostic Analytics: Why Did It Happen?
Digging deeper, I identified the root causes. The analysis revealed two key drivers of low satisfaction:
Poor well-being (Recent Feeling)
Weak work-life balance
These findings moved the conversation forward. Leaders do not just want to know that employees are unhappy, they want to understand why. And this stage provided those answers.
3. Predictive Analytics: What Will Happen Next?
This is where the real innovation comes in. I built an interactive Dash app powered by a Logistic Regression model.
Here’s what it does:
Takes in employee profile data (such as well-being, work-life balance, manager relationships, and office facility satisfaction).
Calculates the probability of that employee being highly satisfied.
Flags individuals at high risk of disengagement before the damage happens.
Imagine the power of not waiting for annual surveys to tell you employees are unhappy but instead getting proactive signals in real-time. Wouldn’t that change how HR and leadership act?
4. Prescriptive Analytics: What Should We Do?
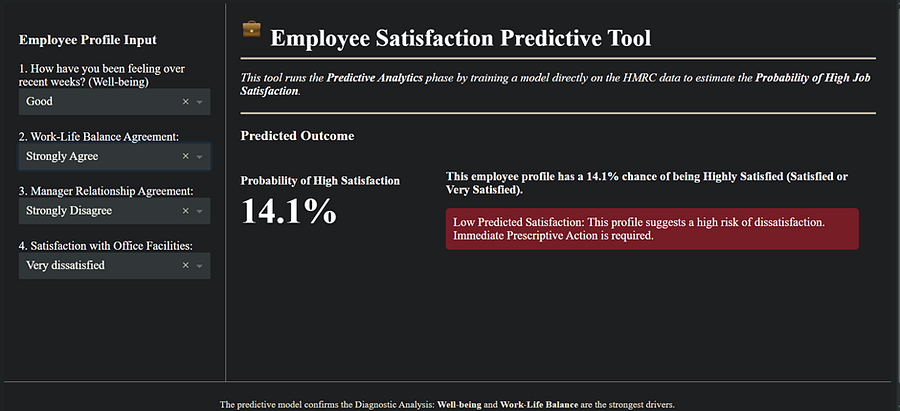
Employee Predictive Dashboard by Author
Prediction is valuable. But action is what drives impact.
Based on the model’s insights, I recommended targeted strategies:
Mental Health Support: Establish serious, well-funded Mental Health Support Programs to directly address the primary Recent Feeling (Well-being) driver.
Career Equity: Implement clear Promotion Paths for all grade levels to boost future outlook and engagement.
Leadership Effectiveness: Mandatory, quarterly Leadership Workshops focused specifically on relationship building and effective management, strengthening the crucial Manager Relationship Agreement driver.
This is not a theoretical promise but a prescriptive road map built directly from the employee data. The dashboards showed exactly where and how to invest for maximum return.
The result? My analysis showed that implementing these steps could lead to at least a 4% improvement in employee satisfaction within six months.
Why This Matters
This project demonstrates how data analysis should evolve:
Don’t stop at descriptive dashboards.
Move into diagnostics to uncover root causes.
Build predictive tools to get ahead of disengagement.
Deliver prescriptive recommendations to guide leadership strategy.
By doing so, analysts do not just report on the past but actively shape the future.
The Code Behind the Model : Below is the complete Python code I used to build and deploy the Dash app.
import dash
from dash import html, dcc
from dash.dependencies import Input, Output
import pandas as pd
from sklearn.model_selection import train_test_split
from sklearn.linear_model import LogisticRegression
from sklearn.preprocessing import OneHotEncoder
from sklearn.compose import ColumnTransformer
from sklearn.pipeline import Pipeline


# The CSV data file must be in the same directory
DATA_FILE = '/home/yoadeoye/mysite/404183 People Analytics and Insights Officer Data Exercise.csv'

# Column names used during training
COLUMNS = [
    'Overall_Satisfaction', 'Work_Life_Balance_Agreement',
    'Manager_Relationship_Agreement', 'Prefer_WfH_Agreement',
    'Recent_Feeling', 'Office_Facility_Satisfaction',
    'Higher_Grade_Interest', 'Working_Pattern',
    'Grade', 'Office_Location'
]

# Features used for prediction
FEATURES = [
    'Recent_Feeling',
    'Work_Life_Balance_Agreement',
    'Manager_Relationship_Agreement',
    'Office_Facility_Satisfaction'
]

# Hard-coded unique options for the select boxes (for display consistency)
INPUT_OPTIONS = {
    'Recent_Feeling': ['Not good', 'Okay', 'Not good at all', 'Good', 'Very good'],
    'Work_Life_Balance_Agreement': ['Strongly Disagree', 'Strongly Agree', 'Neither disagree nor agree', 'Disagree',
                                    'Agree'],
    'Manager_Relationship_Agreement': ['Strongly Disagree', 'Disagree', 'Neither disagree not agree', 'Agree',
                                       'Strongly Agree'],
    'Office_Facility_Satisfaction': ['Dissatisfied', 'Neither satisfied nor dissatisfied', 'Very dissatisfied',
                                     'Satisfied', 'Very satisfied']
}


# --- Model Training Function ---

def recode_satisfaction_binary(satisfaction):
    """Defines the binary target variable (1=High Satisfaction, 0=Low)."""
    if satisfaction in ['Satisfied', 'Very satisfied']:
        return 1  # High Satisfaction
    else:
        return 0  # Low Satisfaction


def load_and_train_model():
    """
    Loads data, trains the model pipeline.
    """
    try:
        # Attempt to read the file. If it fails, a FileNotFoundError is raised.
        df = pd.read_csv(DATA_FILE)
        df.columns = COLUMNS  # Apply consistent column names

    except FileNotFoundError:
        # Catch the file not found error raised by pandas
        raise FileNotFoundError(f"Error: Data file '{DATA_FILE}' not found. Please place the CSV file in the same directory.")

    except Exception as e:
        # Catch any other data loading/parsing errors
        raise ValueError(f"Error loading data: {e}")

    # 1. Target and Features
    df['High_Satisfaction'] = df['Overall_Satisfaction'].apply(recode_satisfaction_binary)
    Y = df['High_Satisfaction']
    X = df[FEATURES]

    # 2. Data Transformation Pipeline (One-Hot Encoding)
    preprocessor = ColumnTransformer(
        transformers=[
            ('onehot', OneHotEncoder(handle_unknown='ignore', sparse_output=False), FEATURES)
        ],
        remainder='passthrough'
    )

    # 3. Model Training Pipeline
    model = Pipeline(steps=[
        ('preprocessor', preprocessor),
        ('classifier', LogisticRegression(solver='liblinear', random_state=42))
    ])

    # Fit the model (Training happens here)
    model.fit(X, Y)

    return model


# --- Prediction Function ---

def make_prediction(model, input_data):
    """Makes a prediction for the given input data."""
    input_df = pd.DataFrame([input_data])

    # Predict the probability of the positive class (1: High Satisfaction)
    # [0] selects the probability for the negative class, [1] for the positive class
    prediction_proba = model.predict_proba(input_df)[0][1]

    return prediction_proba


# Load and train the model
predictor = load_and_train_model()

# --- Dash App ---

app = dash.Dash(__name__)

app.layout = html.Div(style={'backgroundColor': '#1e1e1e', 'color': 'white', 'minHeight': '100vh', 'padding': '0', 'margin': '0'}, children=[
    # Main container with flex for side by side
    html.Div([
        # Sidebar
        html.Div([
            html.H3("Employee Profile Input", style={'color': 'white', 'marginBottom': '20px'}),

            html.Label("1. How have you been feeling over recent weeks? (Well-being)", style={'color': 'white', 'marginBottom': '5px'}),
            dcc.Dropdown(
                id='recent-feeling',
                options=[{'label': opt, 'value': opt} for opt in INPUT_OPTIONS['Recent_Feeling']],
                value=INPUT_OPTIONS['Recent_Feeling'][0],
                style={'backgroundColor': '#333', 'color': 'white', 'border': 'none', 'marginBottom': '20px'}
            ),

            html.Label("2. Work-Life Balance Agreement:", style={'color': 'white', 'marginBottom': '5px'}),
            dcc.Dropdown(
                id='wlb-agreement',
                options=[{'label': opt, 'value': opt} for opt in INPUT_OPTIONS['Work_Life_Balance_Agreement']],
                value=INPUT_OPTIONS['Work_Life_Balance_Agreement'][0],
                style={'backgroundColor': '#333', 'color': 'white', 'border': 'none', 'marginBottom': '20px'}
            ),

            html.Label("3. Manager Relationship Agreement:", style={'color': 'white', 'marginBottom': '5px'}),
            dcc.Dropdown(
                id='manager-relationship',
                options=[{'label': opt, 'value': opt} for opt in INPUT_OPTIONS['Manager_Relationship_Agreement']],
                value=INPUT_OPTIONS['Manager_Relationship_Agreement'][0],
                style={'backgroundColor': '#333', 'color': 'white', 'border': 'none', 'marginBottom': '20px'}
            ),

            html.Label("4. Satisfaction with Office Facilities:", style={'color': 'white', 'marginBottom': '5px'}),
            dcc.Dropdown(
                id='office-facility-satisfaction',
                options=[{'label': opt, 'value': opt} for opt in INPUT_OPTIONS['Office_Facility_Satisfaction']],
                value=INPUT_OPTIONS['Office_Facility_Satisfaction'][0],
                style={'backgroundColor': '#333', 'color': 'white', 'border': 'none', 'marginBottom': '20px'}
            ),
        ], style={
            'width': '25%',
            'padding': '20px',
            'backgroundColor': '#1e1e1e',
            'borderRight': '1px solid #333',
            'boxSizing': 'border-box'
        }),

        # Main content
        html.Div([
            html.Div([
                html.Img(src="https://img.icons8.com/emoji/48/000000/briefcase-emoji.png", style={'height': '30px', 'marginRight': '10px'}),
                html.H1("Employee Satisfaction Predictive Tool", style={'display': 'inline-block', 'verticalAlign': 'middle', 'margin': '0'}),
                html.Hr(style={'border-top': '2px solid black'})
            ]),

            dcc.Markdown(
                "This tool runs the **Predictive Analytics** phase by training a model directly on the HMRC data to estimate the **Probability of High Job Satisfaction**.",
                style={'fontStyle': 'italic', 'marginBottom': '20px', 'color': 'white'}
            ),
            html.Hr(style={'border-top': '2px solid black'}),
            html.H3("Predicted Outcome", style={'marginBottom': '20px', 'color': 'white'}),

            html.Div(id='prediction-output')
        ], style={
            'flex': '1',
            'padding': '20px',
            'boxSizing': 'border-box'
        })
    ], style={'display': 'flex', 'minHeight': 'calc(100vh - 50px)'}),

    html.Div(
        dcc.Markdown(
            "The predictive model confirms the Diagnostic Analysis: **Well-being** and **Work-Life Balance** are the strongest drivers.",
            style={'fontSize': 'small', 'textAlign': 'center', 'color': '#aaa'}
        ),
        style={'padding': '10px', 'backgroundColor': '#1e1e1e', 'borderTop': '1px solid #333'}
    )
])


@app.callback(
    Output('prediction-output', 'children'),
    [
        Input('recent-feeling', 'value'),
        Input('wlb-agreement', 'value'),
        Input('manager-relationship', 'value'),
        Input('office-facility-satisfaction', 'value')
    ]
)
def update_prediction(recent_feeling, wlb_agreement, manager_relationship, office_facility_satisfaction):
    if None in [recent_feeling, wlb_agreement, manager_relationship, office_facility_satisfaction]:
        return html.P("Please select all inputs.", style={'color': 'white'})

    input_data = {
        'Recent_Feeling': recent_feeling,
        'Work_Life_Balance_Agreement': wlb_agreement,
        'Manager_Relationship_Agreement': manager_relationship,
        'Office_Facility_Satisfaction': office_facility_satisfaction
    }

    prediction_probability = make_prediction(predictor, input_data)

    # Two columns for output, side by side
    return html.Div([
        # Column 1: Metric
        html.Div([
            html.H4("Probability of High Satisfaction", style={'marginBottom': '5px', 'fontSize': '16px', 'color': 'white'}),
            html.H1(f"{prediction_probability * 100:.1f}%", style={'margin': '0', 'color': 'white', 'fontSize': '48px'})
        ], style={'width': '30%', 'display': 'inline-block', 'verticalAlign': 'top'}),

        # Column 2: Message and alert
        html.Div([
            dcc.Markdown(
                f"**This employee profile has a {prediction_probability * 100:.1f}% chance of being Highly Satisfied (Satisfied or Very Satisfied).**",
                style={'marginBottom': '10px', 'color': 'white'}
            ),
            get_alert(prediction_probability)
        ], style={'width': '65%', 'display': 'inline-block', 'paddingLeft': '20px', 'verticalAlign': 'top'})
    ], style={'display': 'flex'})


def get_alert(prediction_probability):
    if prediction_probability > 0.6:
        return html.Div(
            "High Predicted Satisfaction: This profile suggests a low risk of dissatisfaction and high engagement.",
            style={
                'backgroundColor': '#0f5132',
                'color': 'white',
                'padding': '10px',
                'borderRadius': '5px'
            }
        )
    elif prediction_probability > 0.4:
        return html.Div(
            "Medium Predicted Satisfaction: This profile is borderline. Targeted management check-ins are recommended.",
            style={
                'backgroundColor': '#664d03',
                'color': 'white',
                'padding': '10px',
                'borderRadius': '5px'
            }
        )
    else:
        return html.Div(
            "Low Predicted Satisfaction: This profile suggests a high risk of dissatisfaction. Immediate Prescriptive Action is required.",
            style={
                'backgroundColor': '#721c24',
                'color': 'white',
                'padding': '10px',
                'borderRadius': '5px'
            }
        )


if __name__ == '__main__':
    app.run(debug=True)
Explore the Live Predictive Analytics Dashboard here and validate these recommendations. The Employee Job Satisfaction dashboard here and the short video here.
If you would like to collaborate on similar projects, connect with me, give me some claps and you can buy me a coffee .